
Psychological Assessment: What the Results Mean
Test scores are one part of the picture
A note on interpreting results
Test scores help us understand you or your child’s strengths and where some extra support might help. But they are only one part of the picture. Observations, background information, and how someone manages day-to-day matter just as much. A psychologist interprets scores in context so they are meaningful - scores on their own don’t tell the whole story.
What is a standardised test?
A standardised test has been given to large groups of people the same age, which lets us compare each person’s performance to others the same age or grade level. Each task measures a specific skill under the same conditions for everyone, so the results give a fair view of strengths and challenges.
What types of scores do we report?
How is a diagnosis made?
There are many different types of test scores. At Enfys Psychology most assessment tools use some of the following scores:
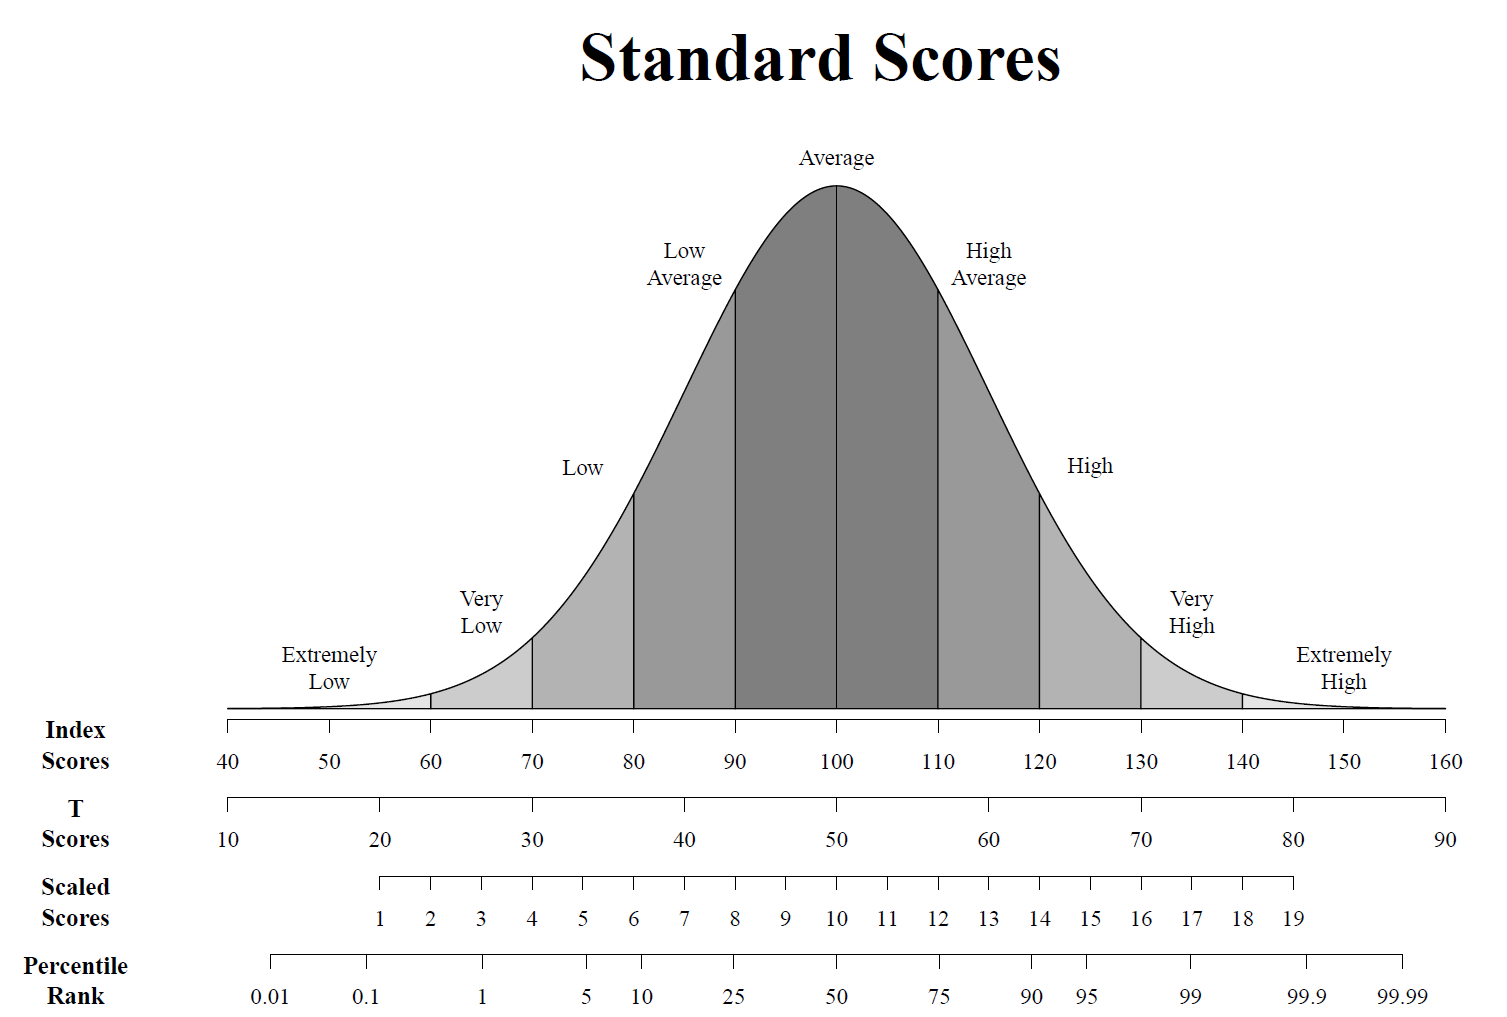
Standard Scores compare performance to other people the same age (peers). The average score is 100, and the average range spans 90 - 109. About two-thirds (or 68%) of people score between 85 and 115.
Scaled Scores are used for some tasks. These have an average of 10, with the range spanning 8 - 12, and most people scoring between 7 and 13. These scores help compare performance across different tasks within the same test.
Percentile Ranks: These indicate how the score compares to others. For example, the 50th percentile means they scored better than 50% of peers but lower than the other 50%.
T-Scores are another way to compare scores, with an average of 50 and most scores falling between 40 and 60. They are commonly used on questionnaires
Confidence Intervals account for the fact that scores can vary a little from day to day. A confident interval shows the range a person’s core is most likely to fall if the assessment was repeated. For example, a score of 100 with a 95% confidence interval of 94 - 106 means that if the person was tested at another time, they would most likely score in that range, rather than get exactly the same score.
Descriptive Categories: These labels put the scores into words - for example, Average or High Average - so they are easier to interpret.
What is the bell curve?
Most standardised test scores follow a pattern called a normal distribution, or bell curve. Most people score near the middle, with fewer scoring very high or very low. The image below shows how the scores above relate to the bell curve.
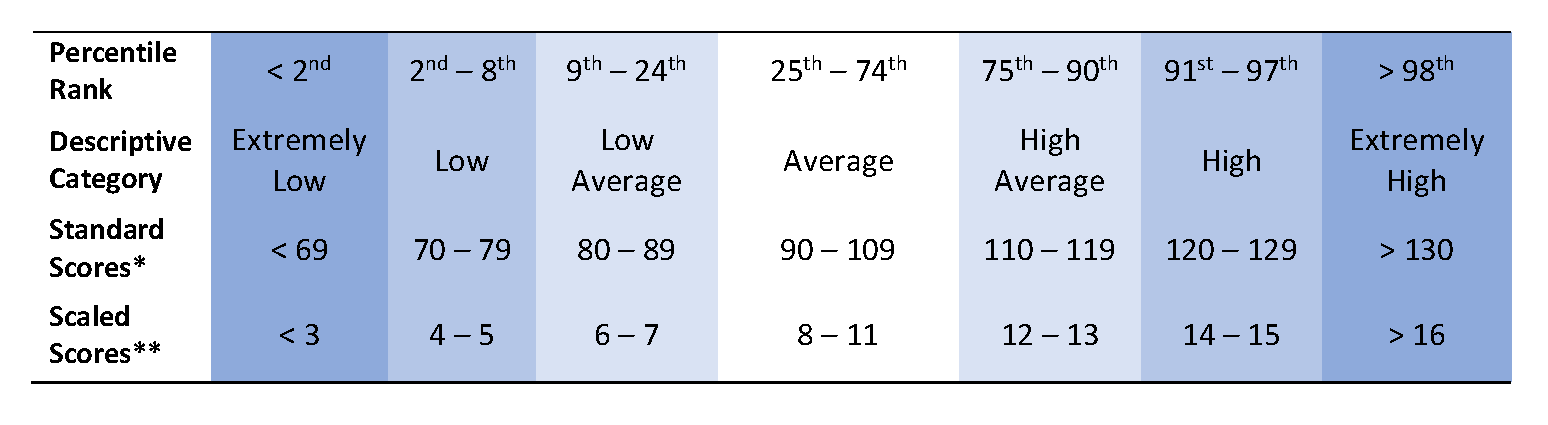
Descriptors used in our reports
What things can affect test scores?
We use the following set of descriptive categories so things are clear for you when you read our reports. Some test publishers use different names, so it’s always worth reading the description alongside the score itself.
Why one score isn’t the full story
*Standard Scores (Indexes/Composites): Mean (average) = 100, Standard Deviation (spread of scores) = ± 15
**Scaled Scores (WISC-V subtests): Mean = 10, Standard Deviation = ± 3
Some scores are made up of several smaller scores combined together. These overall scores are called composites, and the smaller scores that feed into them are called subtests.
Because a composite combines several subtests, it works a bit like an average - and just like any average, it can smooth over real differences underneath. A person might do well on one subtest and find another much harder, yet end up with a composite that looks unremarkable. The single overall number wouldn't show that the two underlying skills were actually quite far apart.
This is why we don't rely on any one figure on its own. We look at the whole pattern of scores - where someone is strong, where they find things harder, and how those pieces fit together - rather than reading a single composite as the full story.
What an assessment can and can’t do
People can perform differently from one day to the next, so any individual score simply reflects how someone performed on that particular day. Cognitive tests measure problem-solving and recall, and while they're reasonably good predictors of learning and academic success, results can also be shaped by:
Interests, motivation and attention during testing
Creativity and curiosity
Work habits and study skills
Fatigue and hunger
Communication skills and language experience
Health, missed school, or past trauma
There's also measurement error to consider. In testing, 'error' doesn't mean a mistake was made - it's the small, natural variation in scores that happens because no test is perfect. Factors like concentration, mood, or testing conditions can nudge a result slightly up or down. This is why a score is best understood as an estimate of a person's ability on the day, and why confidence intervals are used to show the range their true ability most likely falls within.
Taken together, all of this means a person's score could be slightly higher or lower if they were tested on a different day.
An assessment gives a detailed, structured picture of how someone thinks, learns, and functions, and how that compares with others their age. It's a powerful tool for understanding strengths, identifying where support will help, and guiding next steps. What it can't do is capture everything about a person in a single sitting, predict exactly how someone will perform in every situation, or replace the knowledge that families, teachers, and the person themselves bring. We always read scores alongside that wider understanding.
A diagnosis is not based on test scores alone, but on a full picture of the person's skills, development, strengths, weaknesses, presentation and functioning.
Diagnoses are made using criteria from the Diagnostic and Statistical Manual of Mental Disorders (DSM-5-TR). To work out whether someone meets the criteria for a diagnosis, we draw on a range of information:
Developmental history
Academic and school history
Work history (if relevant)
Past reports, letters, and assessments
Observations during the assessment
Observations in other settings where possible (e.g. kindergarten, school, home or in the community)
Current test results
All of this is brought together to build a picture of the person's profile, and if a diagnosis is relevant, this will be decided and included in the report.
Diagnosis is not usually the most important part, though. The real goal of our assessment reports is understanding who you are (or who your child is), and learning how to advocate for you, or your child's, needs.
Psychological test data can be easily misinterpreted by anyone unfamiliar with how psychological tests work. Please speak with a psychologist before acting on any interpretation of these scores. Technical information in your report is intended to be read alongside the body of it, not on its own.
If you have any questions about the report, please reach out to the psychologist to discuss them further.